Brick Math Studies
Grades K - 5
A new study of 1400 elementary students shows significant gains in math using the Brick Math curriculum in grades K-5. The study was comprised of 1400 students (666 girls; 734 boys) from North Carolina and New Jersey public elementary schools in rural, suburban, and urban settings. Both males (N= 734) and females (N=666) participated in the study over one unit of math content. Teachers chose a book to work from and students were provided a pre-assessment of the topic designed by the teacher based upon the standards required by the curriculum in the student’s respective state. Once the topic was decided on and the pre-assessment administered, the teacher chose lessons from Brick Math to address the chosen standards and presented students with the Build-Write-Draw process of the program. Upon completion of the chosen lessons, a post-assessment was administered using the Brick Math assessments that related to the required standards. At least 200 students were taught with and assessed on each of 6 topics: Counting and Cardinality, Addition, Subtraction, Multiplication, Division, and Basic Fractions. More students were tested in basic fractions than in other topics. This is due in part to the teachers’ choice as well as the amount of time dedicated to fractions within the curriculum for students in grades 4 and 5. Instruments used in the study: The study utilized two instruments, one of which was used throughout the unit of math being taught. The Overall Math Engagement Scale developed by the researcher combines Likert-scaled scores rated 0-5 from the following 10 factors: focus and attention, body language, perseverance, numbers of questions asked during the lesson, enthusiasm, confidence, clarity and understanding, verbal participation, meaning making, and performance. The data shows significance between groups slightly over the p value of 0.05 (p = 0.06) regarding gender in the combination of the 10-factor Engagement Scale score. The second instrument utilized in the study was designed to measure the pre to post gains based on answers to 10 questions about the standard being taught at each grade level and from the chosen book topic. The instruments used in the pre-assessment included 10 questions regarding the content in the standards identified by each of the teachers. The design of the questions included students answering the question using any chosen manipulative, drawing a solution, and explaining their answers where appropriate, either in writing or orally. The post-assessments also included 10 questions but the post-assessment questions were taken from the student assessments in the Brick Math program for the associated grade level standards to include the build-write-draw process using bricks as the manipulative. The scores were compared based upon the number of correct answers on the pre-assessment as compared to the post-assessment. A correlation between the Engagement Scale score and the overall pre-to-post gains was investigated to determine if there were any connections to engagement and post gains. Each of the 10 factors was also analyzed along with the post gains to investigate any relationships between the factors and student score increases or decreases. Findings Pre to Post Differences in Achievement: Across the 1400 subjects, students made gains ranging from zero points to 8 points. 1074 of the 1400 students made gains between 4 and 6 points pre to post-test; 44 participants made gains greater than 6 points, and only 11 students made no gains. 110 students made minimal gains of 1 to 2 points. The following table shows the breakdown of pre to post gains across the 1400 participants. Table: Pre to post gains Points gained N 0 11 1 36 2 74 3 162 4 359 5 506 6 208 7 43 8 1 Gender and Engagement: Using a one-way ANOVA, the data showed no significant difference in two major areas based on gender. First, the results indicate that boys and girls improved equally well when taught with Brick Math. The means for both groups were similar: the girls’ mean pre to post difference was 4.38 and the boys’ mean pre to post difference was 4.46. The second area that showed no significant difference between gender was the factor on the Engagement Rating Scale identified as “enthusiasm for using bricks to learn math.” It is generally assumed that boys enjoy using bricks more than girls; however, this study shows that both genders equally enjoy using bricks in math learning. This mean score was very close for both boys (4.870) and girls (4.877), with girls actually slightly higher. When running a paired sample t-test to look at the link between engagement and gender, there was evidence that it was trending towards significance, but with a 95% confidence rating, it implied slight significance at p= 0.07. Since the p value was not less than 0.05, significance between engagement and gender is not relevant. This means that one gender was not more engaged than another. More boys had the highest attainable engagement scores than girls (boys= 338; girls = 284), but otherwise, the scores remained in close proximity across all engagement score ranges. Engagement Scores and Grade Level: The correlation between engagement and grade level was found to be weak (0.38), showing that grade level is not a determinant of level of engagement with bricks, but significance did exist when running an ANOVA test with the p value slightly less than 0.05. Across grades K-5, the majority of students had high engagement scores greater than 48, with 50 as the highest attainable score. Engagement Scores and Academic Gains: Another area of importance to analyze involves a link between the overall engagement scores and the academic point gains of participants. The findings indicate that significance exists between these two variables (p <0.05); in other words, the higher the engagement score, the greater the gains across grades. Discussion of Findings The findings of the Brick Math study show both boys and girls achieve strong gains in academic achievement using the Brick Math curriculum to teach math concepts. Students with a high confidence level in learning with bricks also had high meaning-making scores, with the mean of 4.60 for confidence on a Likert scale observation rating between 1 and 5, and a meaning-making score mean of 4.81. This suggests that students who have high confidence with the process they are using to learn math create deeper meaning regarding the math itself. Overall, the gains were significant, with all but 11 students making some academic gains. The students who did not make gains had behavior and focus issues and were mostly in younger grades. The findings suggest that neither gender nor grade are particularly relevant to the degree to which students are engaged with the Brick Math process; however, the greatest gains were noted in grades 3-5, which are the tested grades for most schools. This in and of itself is an important finding for schools at a time when motivation and engagement are low among students in math classes at the elementary level.
|


Grades K - 2
A mixed-method study shows significant gains in test scores for math content in grades K - 2 after instruction using Brick Math. The findings from a new study of 600 students in kindergarten, first grade, and second grade show that 398 of the 600 students, or 66.3%, made pre- to post-assessment gains of 4 or more points on a 10-point scale.
Participants:
This study was conducted in public and private school classrooms in New Jersey and North Carolina, in rural, suburban, and urban settings for 200 kindergarten, 200 first grade, and 200 second grade students. Schools included Joseph J. Catena School in Freehold, NJ, and multiple schools in Davidson County, NC.
Implementation:
Each student was given ten problems to complete, in writing or orally, in the areas of counting and cardinality, addition, or subtraction prior to being taught with the Brick Math methods. The same problems were then used with the Brick Math program. Before starting Brick Math, students were asked questions about why they responded in certain ways to the problems to help the researcher identify misconceptions held by students about number sense and computational understanding. Once the problems were completed using the Brick Math methods, the problems were again scored on a scale of 1 - 10 (correct versus incorrect).
Students were then asked to discuss the meaning of the models with the researcher. Students were also encouraged to ask questions for clarity during the teaching process. The discussion of the models yielded some important information about how students learn and understand math. Students in kindergarten made comments such as: “Now I see why 8 is larger than 3,” and ”5 is between 3 and 8.” Students learning about place value said, “Counting bricks in the tens and ones place helps me know what number goes in each place.” A student further explained, “Two 1x2 bricks and four 1x1 bricks show that the tens place is 2 and the ones place is 4, and the whole number is 24.”
Data and Findings:
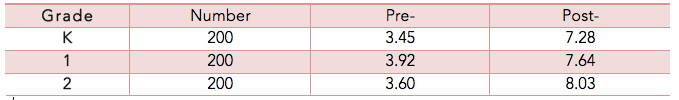
The data was analyzed using a one-way ANOVA from SPSS, which indicates that achievement was statistically significant across all three grade levels and all content materials. A Pearson correlation shows no significance between the performance of girls versus boys. This finding is interesting, in that many believe bricks are preferred by boys. In this study, the girls did as well as the boys in achievement when using Brick Math. The variables measured in the study included: focus and body language when using Brick Math, verbal participation and questioning by the student, the degree to which students were able to make conceptual meanings in the models, performance pre to post (before Brick Math instruction and after Brick Math instruction). It was interesting to note that the degree of focus was significant (p = 0.03) upon introduction of the bricks to do the math problems. The findings also suggest that both the level of performance and the degree of perseverance are directly related to the degree to which the student could focus (p < .05) in all correlations of these variables. The median pre- to post-test difference in the study across all groups was 4 with a range from 0 – 10.
The means are displayed for each grade, pre and post, in the table. The spread of the mean shows wide differences before and after the instruction in each of the three grades, with the largest difference found in grade 2.
A mixed-method study shows significant gains in test scores for math content in grades K - 2 after instruction using Brick Math. The findings from a new study of 600 students in kindergarten, first grade, and second grade show that 398 of the 600 students, or 66.3%, made pre- to post-assessment gains of 4 or more points on a 10-point scale.
Participants:
This study was conducted in public and private school classrooms in New Jersey and North Carolina, in rural, suburban, and urban settings for 200 kindergarten, 200 first grade, and 200 second grade students. Schools included Joseph J. Catena School in Freehold, NJ, and multiple schools in Davidson County, NC.
Implementation:
Each student was given ten problems to complete, in writing or orally, in the areas of counting and cardinality, addition, or subtraction prior to being taught with the Brick Math methods. The same problems were then used with the Brick Math program. Before starting Brick Math, students were asked questions about why they responded in certain ways to the problems to help the researcher identify misconceptions held by students about number sense and computational understanding. Once the problems were completed using the Brick Math methods, the problems were again scored on a scale of 1 - 10 (correct versus incorrect).
Students were then asked to discuss the meaning of the models with the researcher. Students were also encouraged to ask questions for clarity during the teaching process. The discussion of the models yielded some important information about how students learn and understand math. Students in kindergarten made comments such as: “Now I see why 8 is larger than 3,” and ”5 is between 3 and 8.” Students learning about place value said, “Counting bricks in the tens and ones place helps me know what number goes in each place.” A student further explained, “Two 1x2 bricks and four 1x1 bricks show that the tens place is 2 and the ones place is 4, and the whole number is 24.”
Data and Findings:
The data was analyzed using a one-way ANOVA from SPSS, which indicates that achievement was statistically significant across all three grade levels and all content materials. A Pearson correlation shows no significance between the performance of girls versus boys. This finding is interesting, in that many believe bricks are preferred by boys. In this study, the girls did as well as the boys in achievement when using Brick Math. The variables measured in the study included: focus and body language when using Brick Math, verbal participation and questioning by the student, the degree to which students were able to make conceptual meanings in the models, performance pre to post (before Brick Math instruction and after Brick Math instruction). It was interesting to note that the degree of focus was significant (p = 0.03) upon introduction of the bricks to do the math problems. The findings also suggest that both the level of performance and the degree of perseverance are directly related to the degree to which the student could focus (p < .05) in all correlations of these variables. The median pre- to post-test difference in the study across all groups was 4 with a range from 0 – 10.
The means are displayed for each grade, pre and post, in the table. The spread of the mean shows wide differences before and after the instruction in each of the three grades, with the largest difference found in grade 2.

Grades 3-4-5
A mixed-method study shows significant gains in test scores for math content in fractions in grades 4 - 5 after instruction using Brick Math. The findings from a study of 309 students in fourth and fifth grade show average pre- to post-assessment gains of 7-9 points. Significance in areas of engagement and time on task as related to performance was noted across all students participating in the study (p<0 .01).
Participants:
This study was conducted in public and private school classrooms in North Carolina, in rural, suburban, and urban settings for 225 third and fourth grade students using Brick Math multiplication and division materials, and 309 fourth and fifth grade students using Brick Math fractions materials (N= 240 rural; N = 140 suburban; N = 154 urban). 100 students were instructed using the multiplication materials in grades 3 and 4; 125 were instructed using the division materials in grades 3 and 4; and 309 were instructed using the fractions materials in grades 4 and 5.
Data and Findings:
A one-way ANOVA was used to analyze the relationship between student focus/attention to content, engagement/on-task, confidence, and performance across all participants. These variables, when analyzed, showed significance between groups (p< .01). A two-tailed t-test was utilized to analyze the relationship between interest in learning mathematics, body language during the learning segment, and engagement of the students in grades 3-5. With equal variance assumed, data showed significance (p< .01), with the largest correlation being between engagement and interest in learning math.