- Data and Statistics (grades 7-8)
- >
- Data and Statistics: Teacher Edition (paperback)
Data and Statistics: Teacher Edition (paperback)
SKU:
$19.95
$19.95
Unavailable
per item
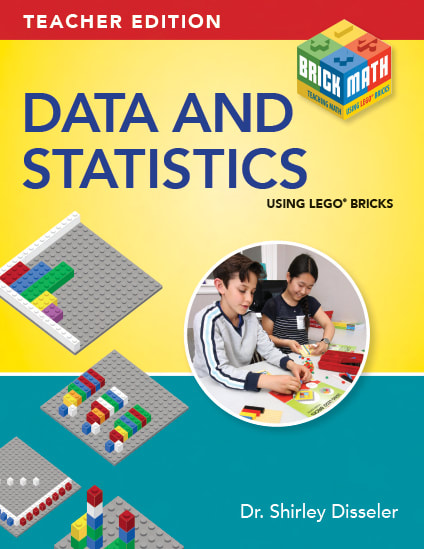
In Brick Math's Data and Statistics, students learn the basics of representing and interpreting data. This Teacher's lesson guide includes chapters on:
Modeling with LEGO® bricks helps students visualize the math and develop deep understanding of data and statistics concepts. Most students learn these data and statistics topics between grades 7 - 8.
Using LEGO® bricks to model math provides a universal language. Students everywhere recognize this manipulative. It’s fun to learn when you’re using LEGO® bricks!
Sample Data and Statistics Lesson
- Representing and Interpreting Data
- Line Plots
- Bar Graphs and Histograms
- Measuring Central Tendency with Mean
- Measuring Central Tendency with Median
- Measuring Central Tendency with Mode
- Measuring Central Tendency with Range
- Box Plots
- Coordinates
- Describing Change Over Time with Line Graphs
- Scatter Plots and Lines of Best Fit
- Slope
- Introduction to Probability
Modeling with LEGO® bricks helps students visualize the math and develop deep understanding of data and statistics concepts. Most students learn these data and statistics topics between grades 7 - 8.
Using LEGO® bricks to model math provides a universal language. Students everywhere recognize this manipulative. It’s fun to learn when you’re using LEGO® bricks!
Sample Data and Statistics Lesson

