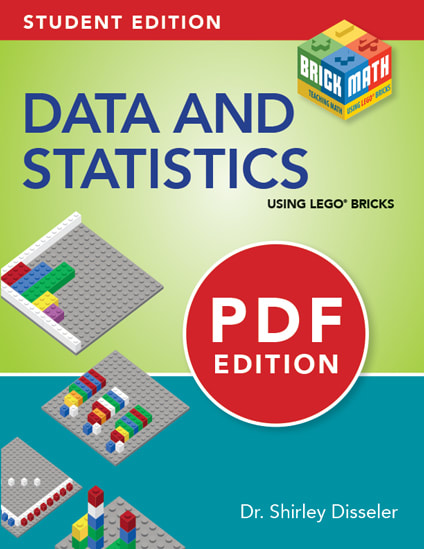
- Data and Statistics (grades 7-8)
- >
- Data and Statistics: Student Edition (PDF)
Data and Statistics: Student Edition (PDF)
Please Note: The Data and Statistics Student Edition is a student workbook and must be used in conjunction with the Brick Math Data and Statistics Teacher Edition book.
YOU'LL RECEIVE PDF IN YOUR EMAIL, TYPICALLY WITHIN 24 HOURS
[SINGLE USE ONLY. PDF SITE LICENSE FOR SCHOOL USE AVAILABLE ON WEBSITE]
In Data and Statistics, students learn the basics of representing and interpreting data with line plots, bar graphs, histograms, and box plots. They learn how to measure central tendency through mean, median, mode, and range. Then students move on to learn about coordinates, line graphs, and scatter plots. Finally, they learn how to graph and calculate the slope of a line. The final chapter is an introduction to both theoretical and experimental probability. Most students learn these data and statistics topics in grades 7 - 8.
This Student Workbook includes chapter assessments, additional problems for practice, plus space to answer questions and baseplate diagrams to draw the brick models students build.
Using LEGO® bricks to model math provides a universal language. Children everywhere recognize this manipulative. It’s fun to learn when you’re using LEGO® bricks!

